Phase envelopes
Two-phase envelopes
Two-phase envelopes show all the saturation points of a mixture, they can be seen as the boundary line of transition between monophasic regions to two-phase equilibria regions.
In yaeos it is possible to calculate two-phase of different kinds.
- Isoplets
Isoplets
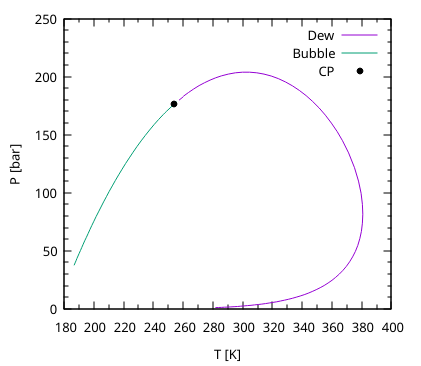
Isoplets are the phase boundaries at constant composition (the global composition) of the system. Here is a simple example with commentaries on how a phase boundary can be calculated:
program phase_diagram
   !! Program for calculation of phase diagrams.
   use forsus, only: Substance, forsus_dir, forsus_default_dir
   use yaeos, only: pr, &
      SoaveRedlichKwong, PengRobinson76, PengRobinson78, RKPR, &
      EquilibriaState, ArModel, PTEnvel2, &
      pt_envelope_2ph, saturation_pressure, saturation_temperature
   use yaeos__phase_equilibria_auxiliar, only: k_wilson
   implicit none

   ! ===========================================================================
   ! Variables definition
   ! ---------------------------------------------------------------------------
   integer, parameter :: nc=2
   class(ArModel), allocatable :: model ! Thermodynamic model to be used
   type(EquilibriaState) :: sat_point   ! Init
   type(PTEnvel2) :: envelope           ! PT Phase envelope
   real(pr) :: tc(nc), pc(nc), w(nc)    ! Component's critical constants
   real(pr) :: n(nc)                    ! Termodynamic variables
   type(Substance) :: sus(nc)           ! Substances to use
   ! ===========================================================================

   ! forsus database directory
   forsus_dir = "build/dependencies/forsus/" // forsus_default_dir

   ! Find the selected substances on the database and extract their
   ! critical constants
   sus(1) = Substance("methane")
   sus(2) = Substance("n-hexane")
   call get_critical_constants(sus, tc, pc, w)

   ! Model definition
   model = PengRobinson76(tc, pc, w)

   ! Composition vector
   n = [0.9_pr, 0.1_pr]

   ! Calculate a dew point at low pressure to later
   ! initialize the phase envelope
   sat_point = saturation_temperature(model, n, P=1._pr, kind="dew", t0=150._pr)

   ! Calculate phase envelope
   envelope = pt_envelope_2ph(model, n, sat_point)

   ! Write the phase envelope to screen
   write(*, *) envelope

contains

   subroutine get_critical_constants(subs, tc_in, pc_in, w_in)
      type(Substance) :: subs(:)
      real(pr), intent(out) :: tc_in(:), pc_in(:), w_in(:)

      tc_in = subs%critical%critical_temperature%value
      pc_in = subs%critical%critical_pressure%value/1e5
      w_in = subs%critical%acentric_factor%value
   end subroutine
end program phase_diagram
The output of the write command will be pre-formatted. Showing in tabular
data with this
# PTEnvel2

# kind of sat point
kind T P [liquid-phase composition vector] [gas-phase composition vector]

# other kind of sat point
kind T P [liquid-phase composition vector] [gas-phase composition vector]

# Critical
T P
Which when plotted with gnuplot with:
plot "outfile" \
        index "dew"      u 2:3 w l title "Dew", \
     "" index "bubble"   u 2:3 w l t "Bubble", \
     "" index "Critical" u 1:2 w p pt 7 lc rgb "black" t "CP"
Gives the following plot:
